
Introduction As the end of July approaches, many families are preparing for the back-to-school season.…
What Is CPI and Why Does It Move Mortgage Rates?
May 2026 | GTG Financial | Santa Rosa, CA
TL;DR: What’s in This Post
- What CPI actually measures and how it is reported
- The difference between headline CPI and core CPI, and why it matters
- How the inflation report typically moves mortgage rates the same day it drops
- Why energy prices have been driving the recent headline jump
- What to watch in the numbers and how to read the release
Every month there is one report that can move mortgage rates before most people finish their morning coffee. It is called CPI, and if you have buyers watching rates right now, understanding what it is and how it works will help you explain a lot of what is happening in the market.
What CPI Actually Measures
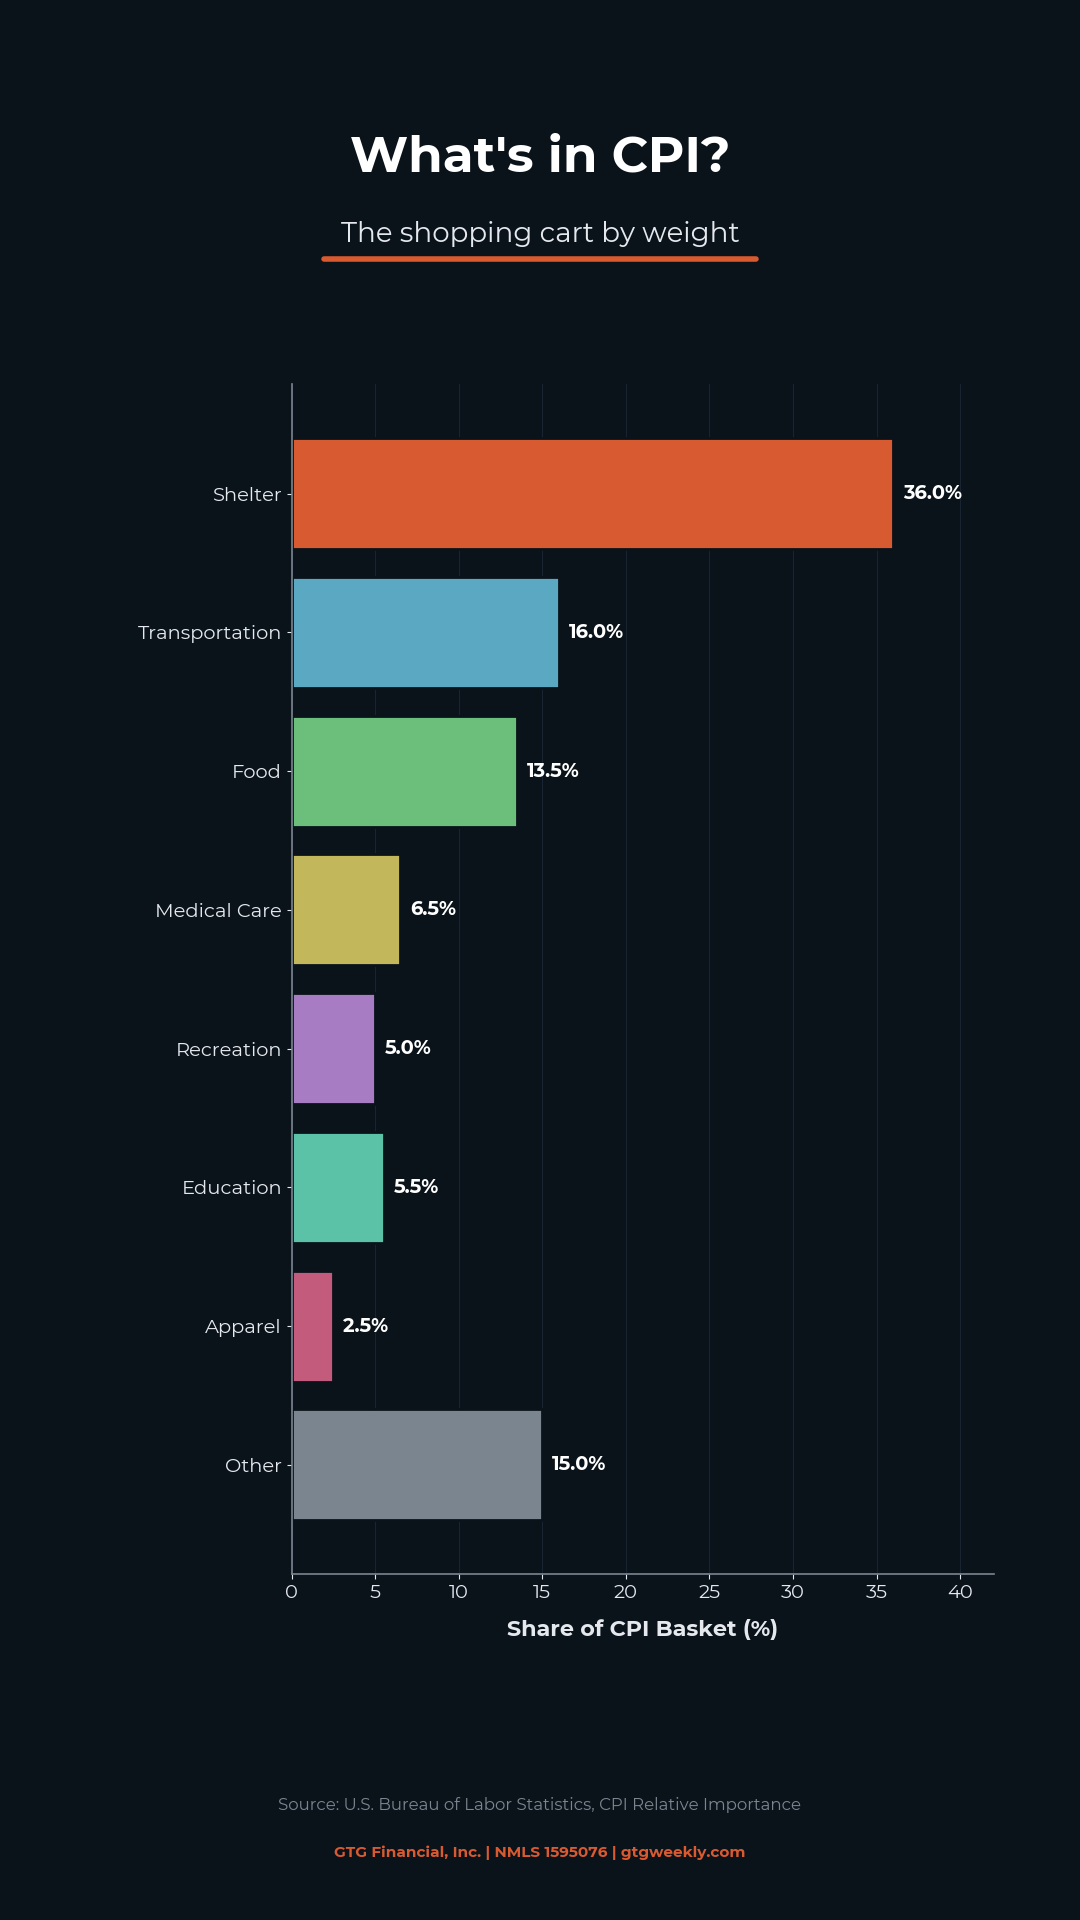
CPI stands for Consumer Price Index. The easiest way to think about it is a giant shopping cart filled with what Americans typically buy. Every month, the Bureau of Labor Statistics goes out and checks what that cart costs. The change in that cost from month to month, and year to year, is what gets reported as inflation.
That cart includes groceries, gasoline, rent, insurance, and doctor visits, among other things. The BLS publishes the report once a month, usually in the second week, and it tends to land early in the morning when bond markets are already open and reacting.
CPI is reported two ways. The headline number includes everything in the cart. The core number strips out food and energy, because those two categories tend to swing the most and can distort the underlying picture. The Federal Reserve watches core closely because it shows the cleaner trend underneath all the volatility.
Headline vs Core: Why the Difference Matters Right Now
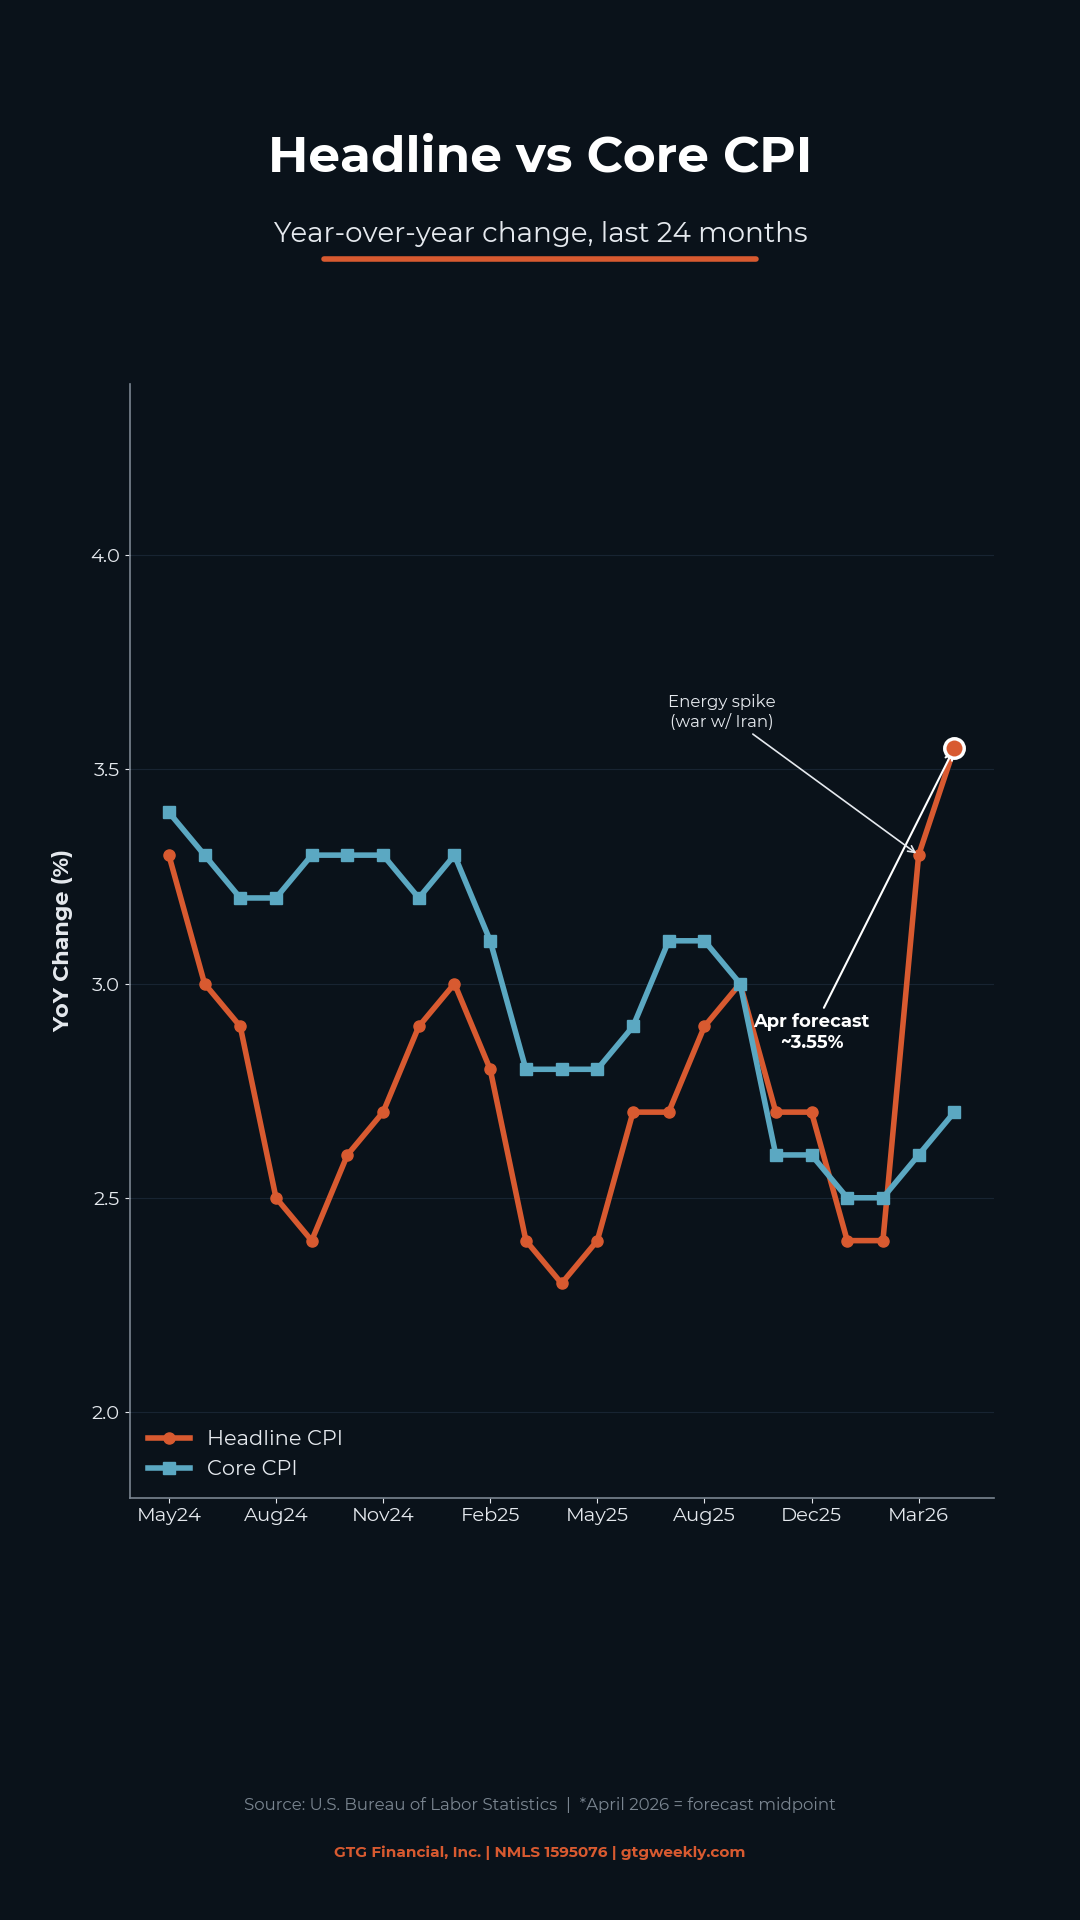
The gap between headline and core is where the story often lives. When energy prices are stable, headline and core tend to run close together. When energy spikes, headline can jump while core stays relatively calm, and that split tells you something important about what is actually happening in the economy.
Right now, headline inflation has climbed to 3.3%, while core has held more steady at 2.6%. That gap is almost entirely driven by gasoline. The rest of the economy is not running away. Energy is. Understanding that distinction matters when you are trying to explain to a buyer why rates are elevated even though their grocery bill has not gone crazy.
The Fed’s language around this has been consistent: they are watching core more than headline. If core can hold, the rate picture does not necessarily get worse even when headline climbs. That is the dynamic worth tracking every time this report drops.
Why CPI Moves Mortgage Rates
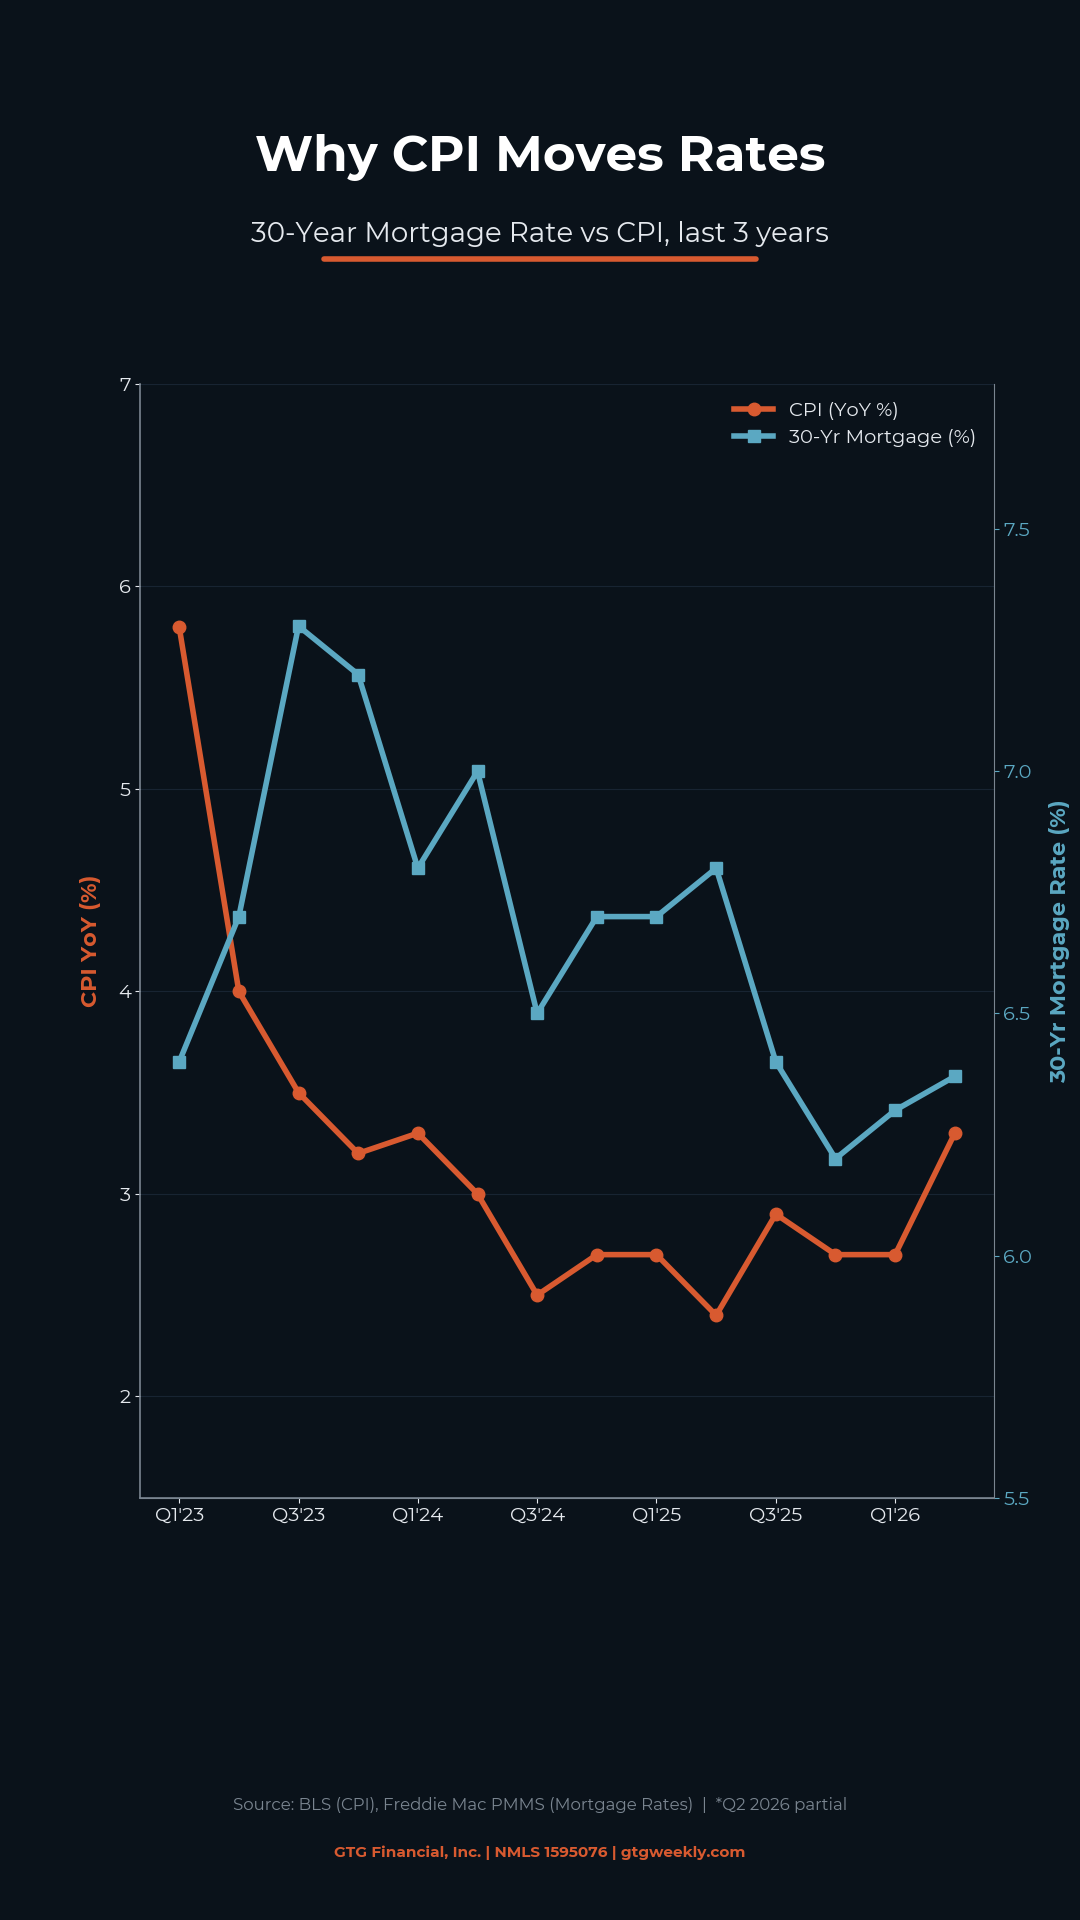
Mortgage rates come from bonds. Bonds are essentially loans that pay investors a fixed amount over time. When inflation runs hot, those future dollars are worth less in real terms, so investors demand higher payments upfront to make the deal worth it. Higher payments mean higher rates. When inflation cools, those future dollars hold their value and investors will accept lower payments, which generally means rates can ease back.
That is why the CPI release can move rates the same morning it drops. Bond markets are forward-looking and they price in expectations, but a print that comes in hotter or cooler than forecast will still move the needle in real time. A surprise to the upside tends to push rates higher. A surprise to the downside tends to bring some relief.
This is also why the core number gets so much attention. If core is calm, bond investors can look through the headline volatility and hold their ground. If core starts climbing alongside energy, that is a different signal entirely and the rate response tends to be sharper.
The Energy Story Behind the Current Numbers
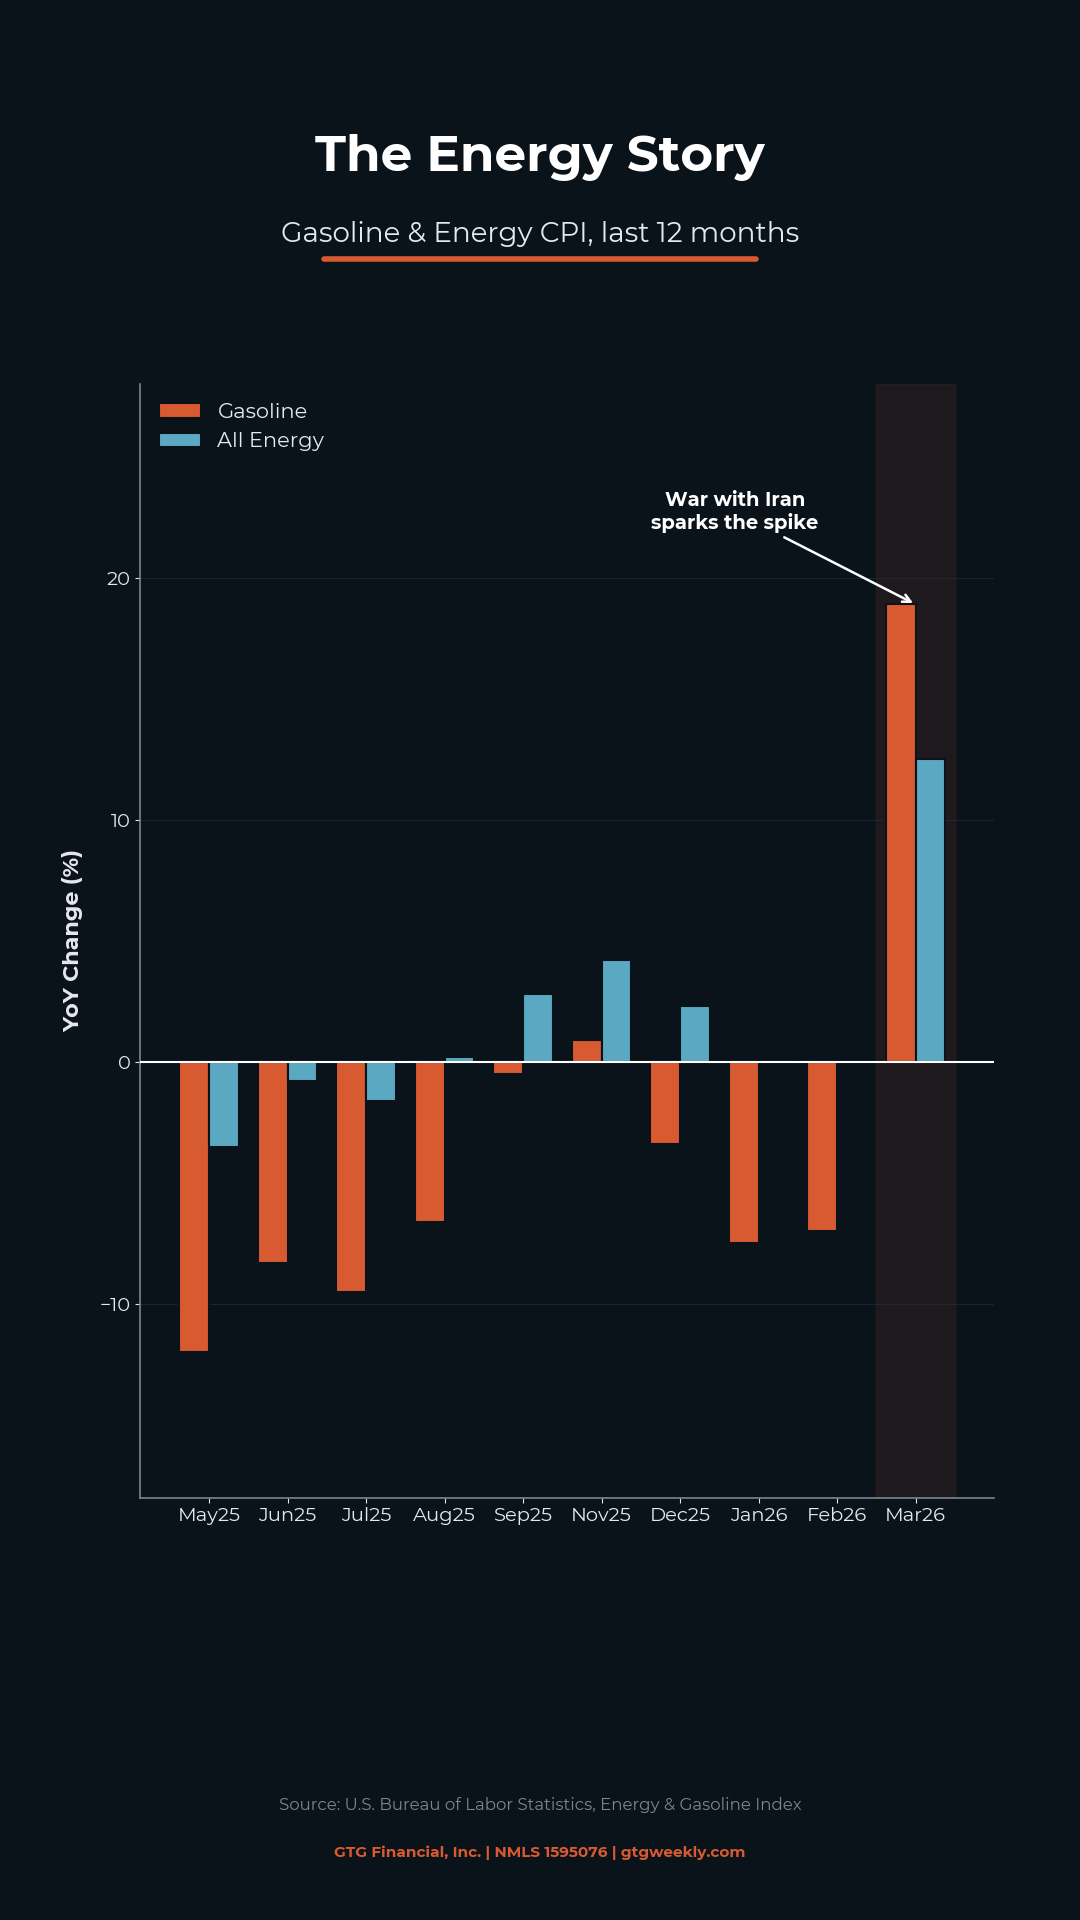
The recent jump in headline inflation has been driven almost entirely by energy. Gasoline went from roughly -7.5% year over year in January to +18.9% in March. That is a significant swing, and it is showing up in the headline number in a meaningful way.
California refineries are built to process heavy crude, which typically comes from the Middle East. When that supply gets disrupted, gas prices here tend to climb faster than the national average. That is part of why this region tends to feel energy inflation more acutely than other parts of the country.
The key question for rates is whether that energy pressure bleeds into core. So far, core has stayed relatively contained at 2.6%. If it holds there, the rate environment is uncomfortable but not accelerating. If core starts moving up toward 3% or higher, the picture changes and the Fed’s options narrow.
How to Read the Next CPI Release
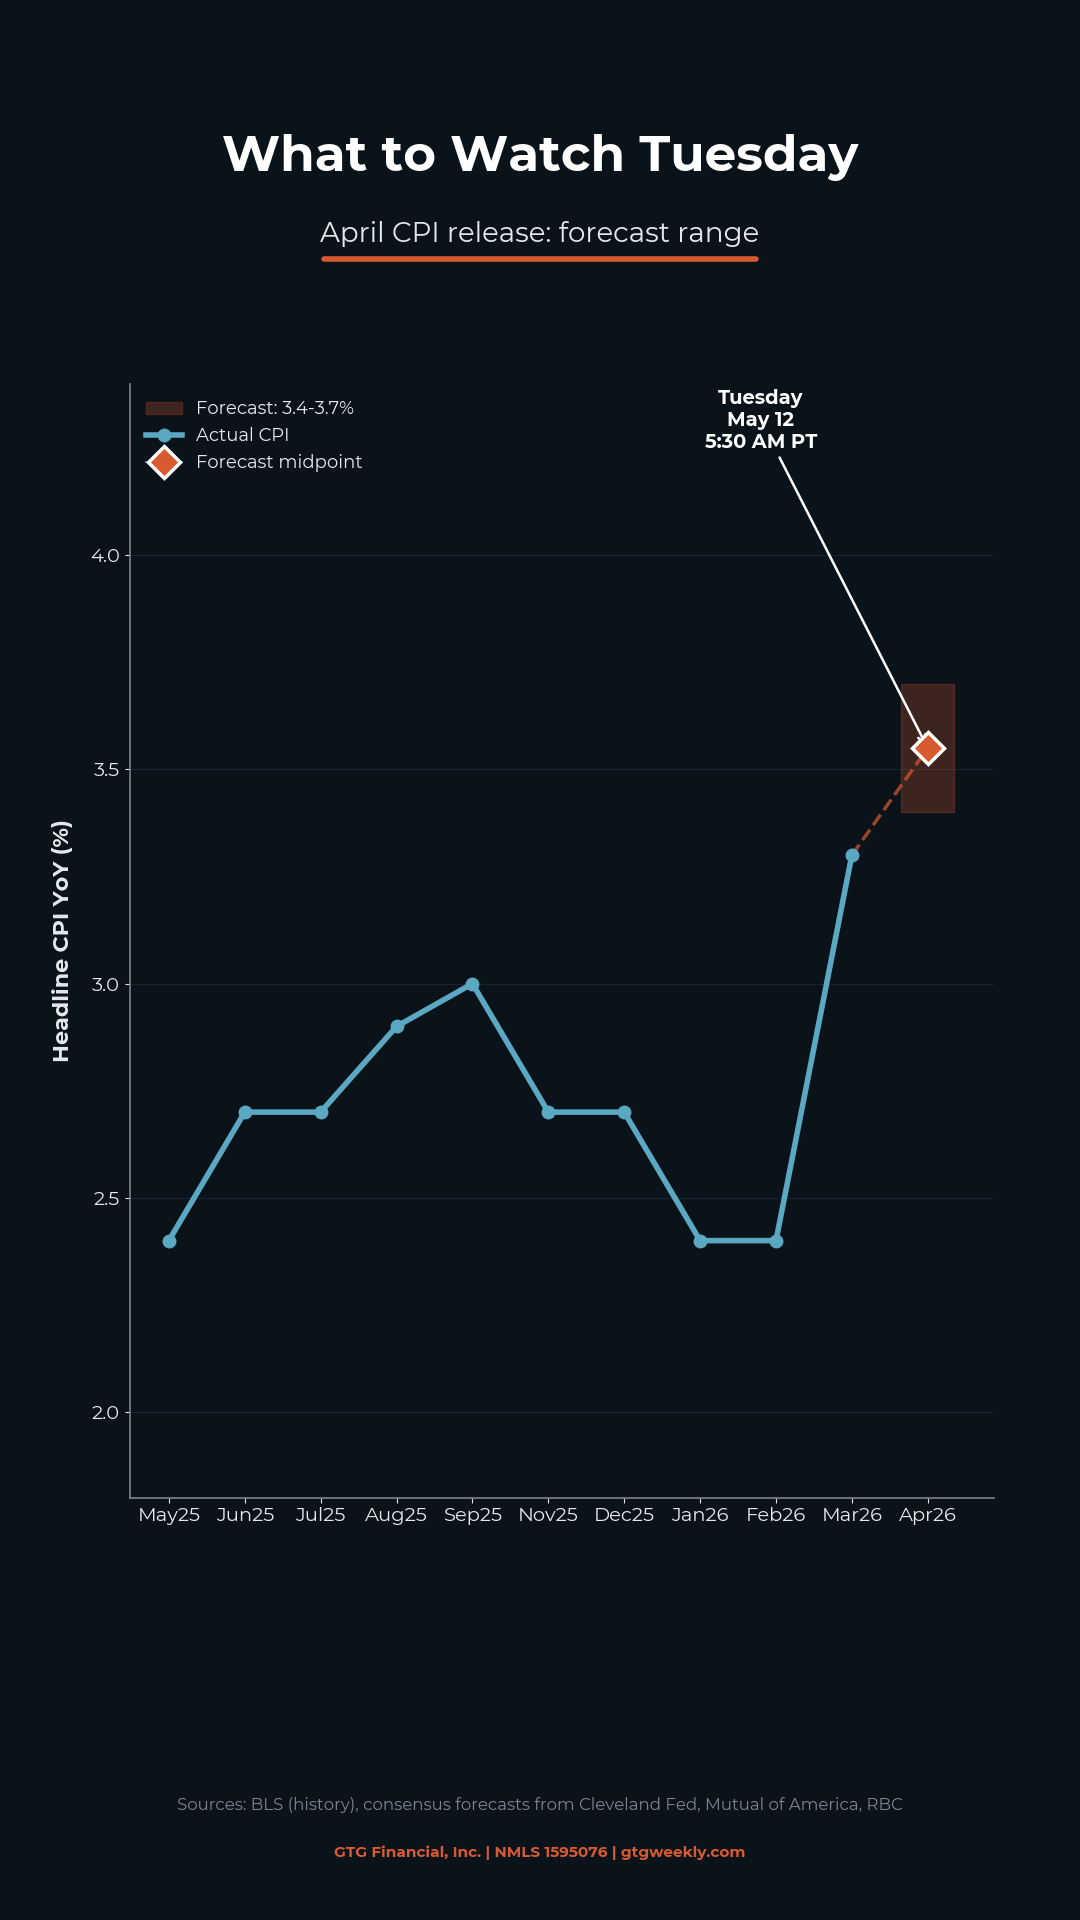
When the CPI report drops, the number you want to look at first is core. Headline will get the news cycle, but core is what the Fed and bond markets are actually weighing. Forecasts for the upcoming release generally run 3.4 to 3.7% on headline and around 2.7% on core.
If core comes in at or below the forecast, rates will likely hold or potentially ease. If core surprises to the upside and climbs alongside energy, that is when you tend to see a sharper bond market reaction and rates move higher in response.
The practical translation for buyers: this report typically drops early on a Tuesday morning. If your buyers are rate-sensitive and sitting on a decision, that morning is worth watching. A cooler-than-expected print can open a window. A hotter print can close one that had just started to look promising.
What This Means for Your Buyers
The headline number is going to say what it says, and the media coverage is usually focused there. What matters more for the rate picture is what is underneath. Energy-driven inflation and broad economic inflation are two different problems, and so far the underlying economy has been holding reasonably steady.
When clients ask why rates are high even though things seem okay, this is the answer. It is mostly energy. It is mostly gasoline. The Fed is watching the same thing you are, and until core starts moving in a sustained way, the expectation is that rates can hold in the current range rather than climbing further.
The headline number gets the attention. Core is what actually moves the rate needle.
If you are in Sonoma County or the North Bay and want to talk through what the current rate environment looks like for a specific buyer scenario, reach out. That conversation is free and usually clarifies a lot.
Glenn Groves
Mortgage Broker | GTG Financial | Santa Rosa, CA
NMLS #1124642 | gtgfi.com
GTG Financial, Inc. NMLS #1595076 | CA DRE #02029711. Equal Housing Opportunity. Not a commitment to lend. Subject to credit approval and underwriting. Rates and terms subject to change without notice. Individual rates vary based on credit profile, property type, occupancy, loan amount, and other factors. nmls consumeraccess.org
Related Posts